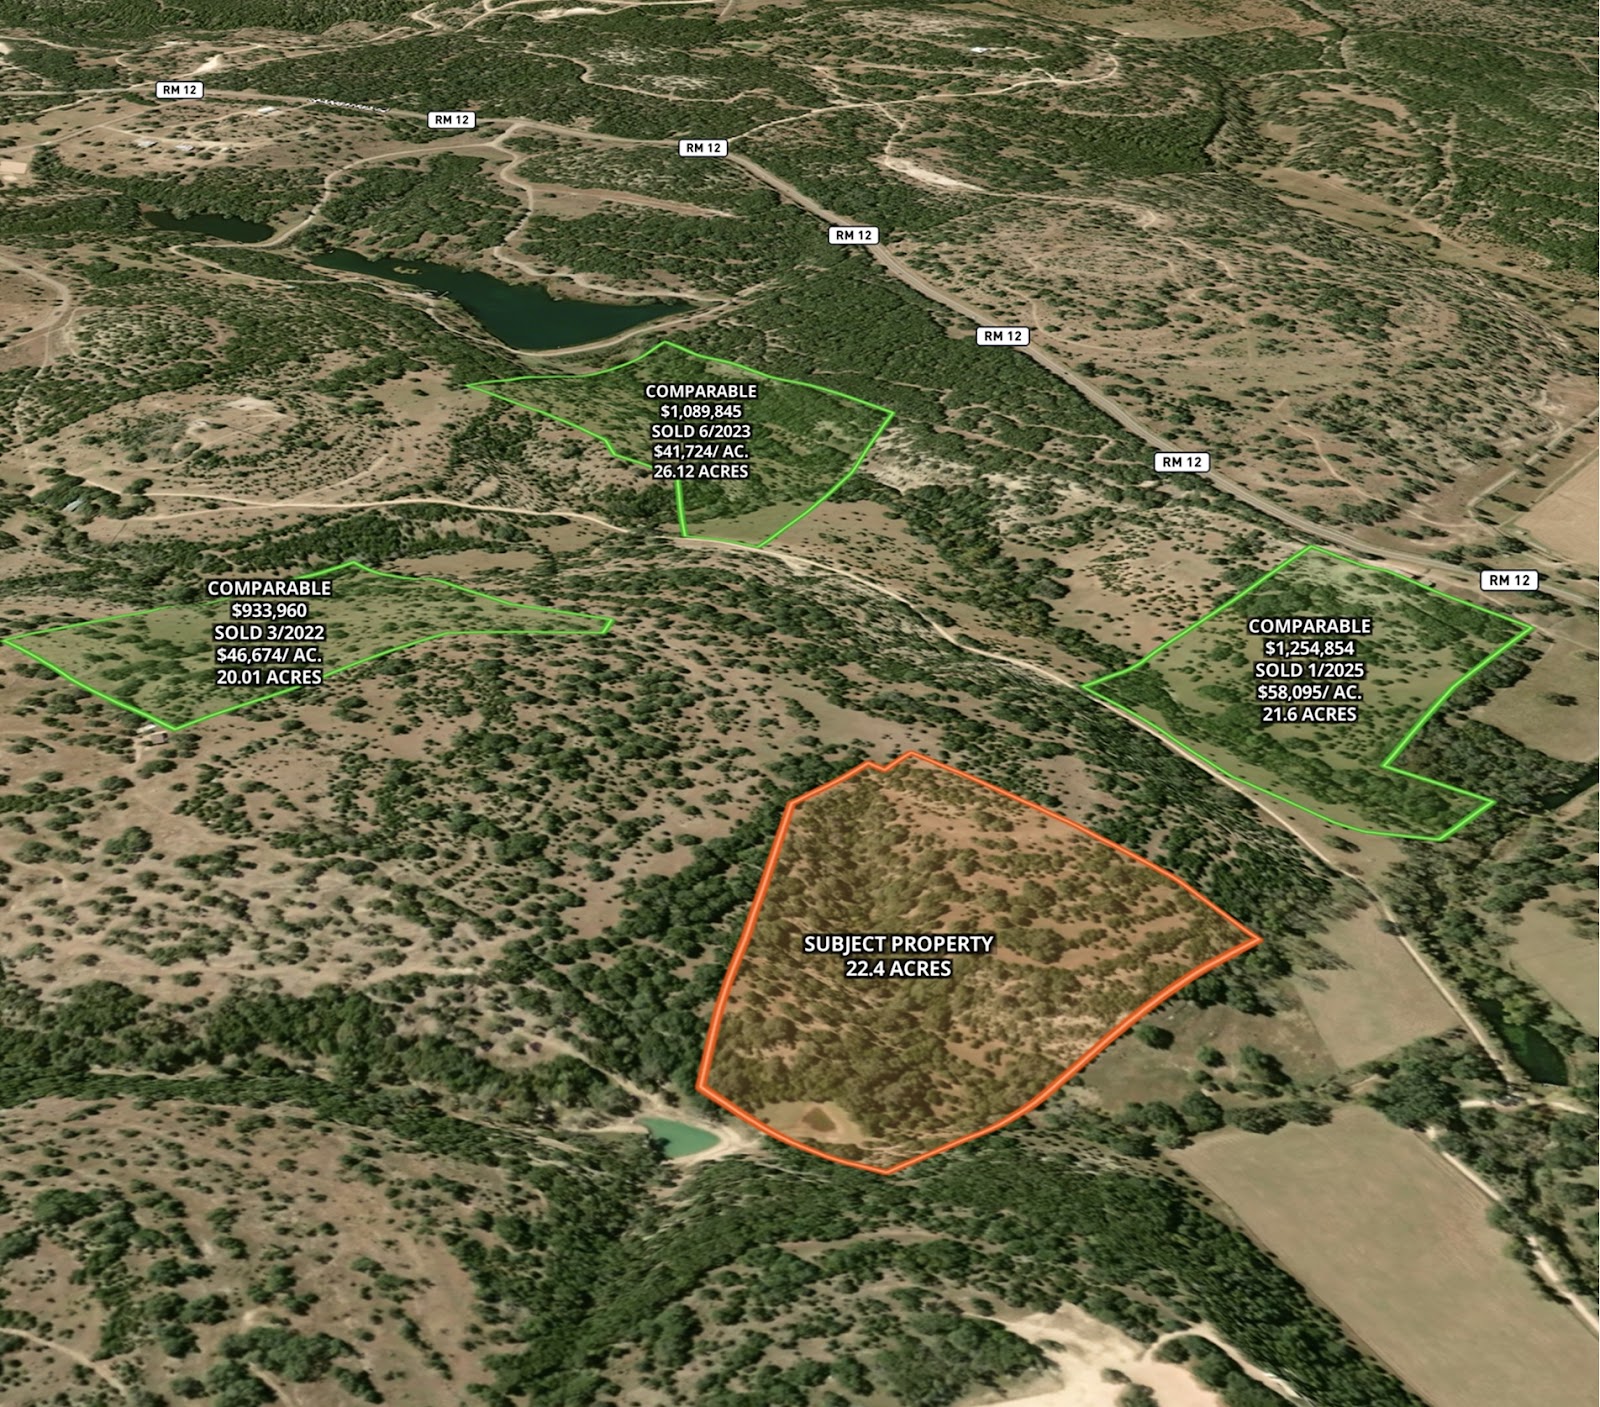
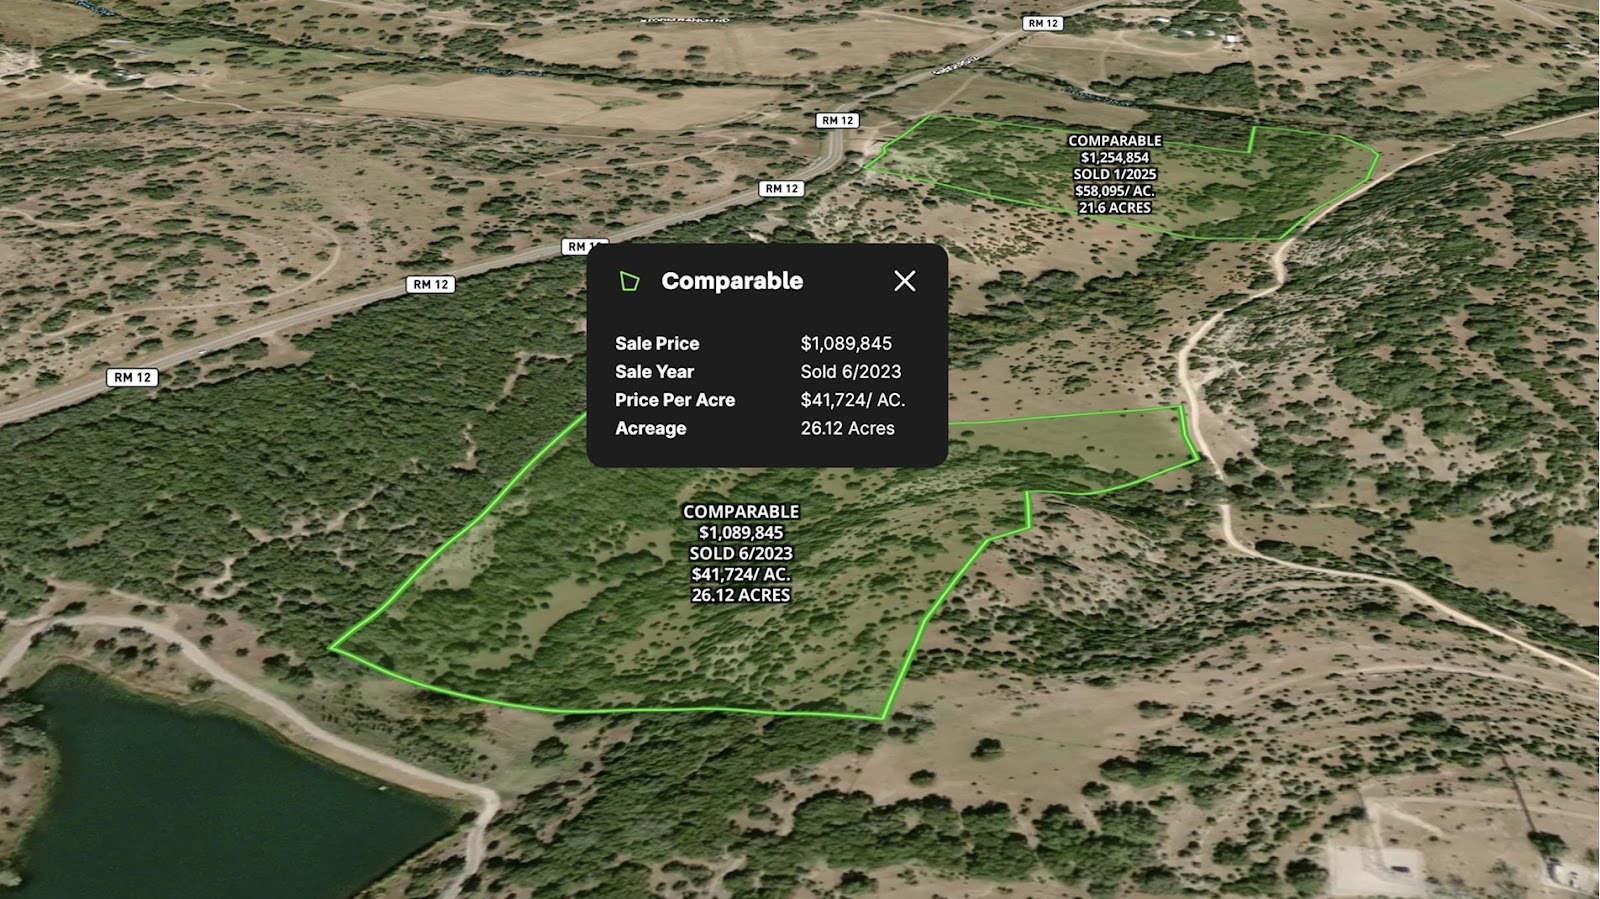
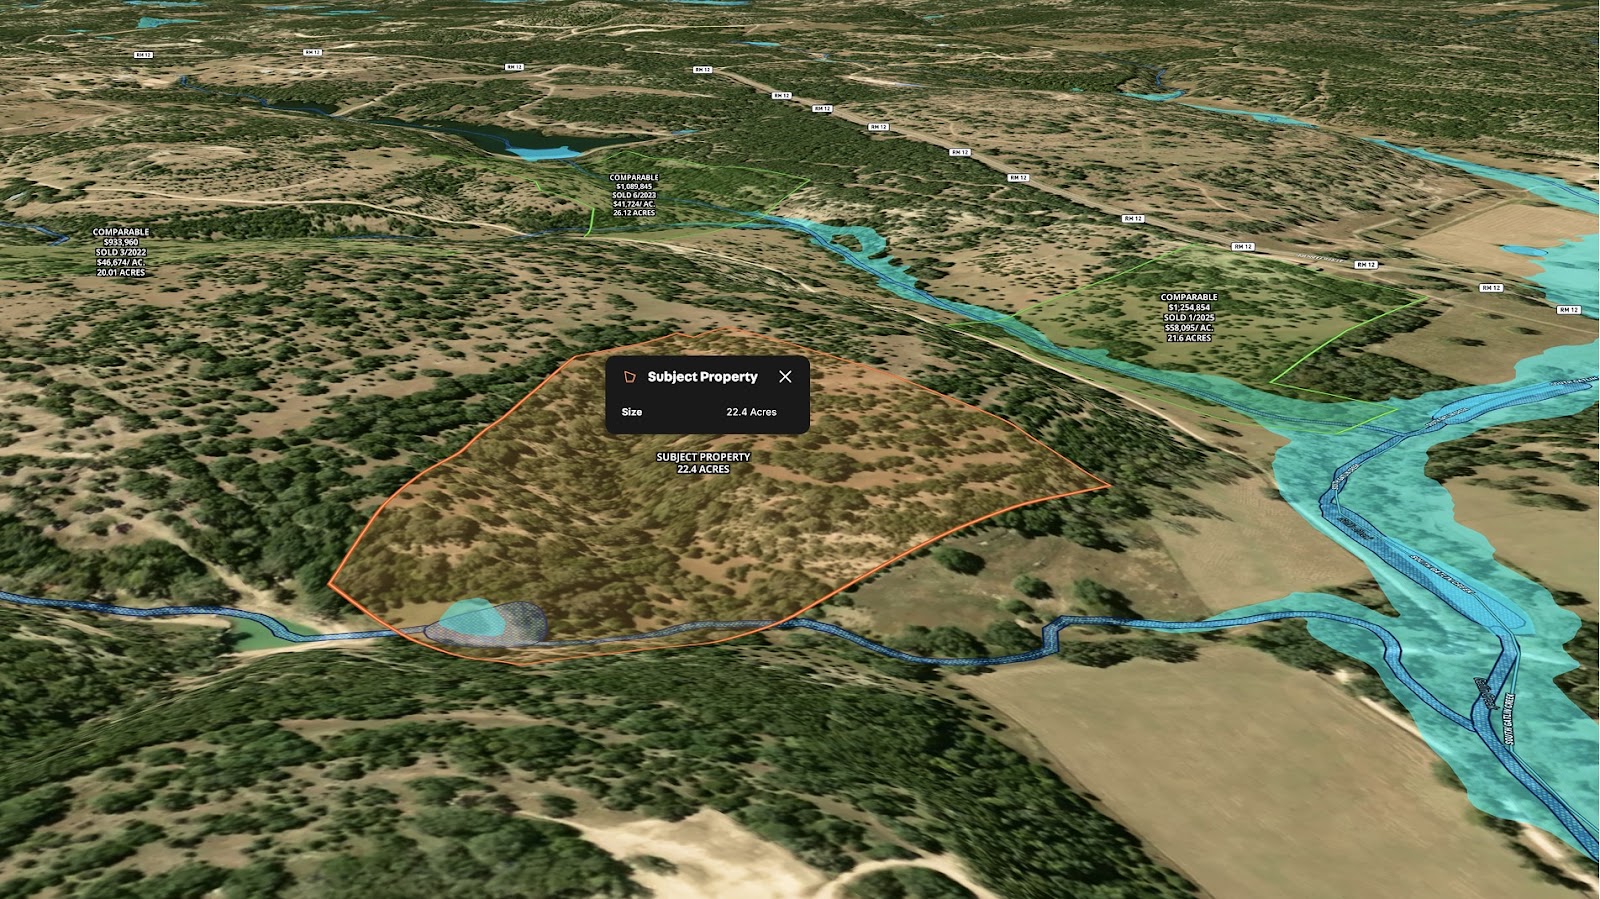
Simplify the way you present market data with Land id®. This example map highlights a subject property alongside nearby comparable sales, providing a clear visual representation of market values. Each comparable includes key data points such as Price, Sold Date, Acreage, and Price Per Acre, helping clients quickly understand property trends.
With interactive mapping, users can easily compare properties, identify pricing patterns, and make informed decisions. Whether for buyers, sellers, or investors, this map transforms raw data into meaningful insights at a glance.
Enhance your client presentations with intuitive, data-driven visuals.
Learn How to Create a Map Like This:
- How to make maps in Land id
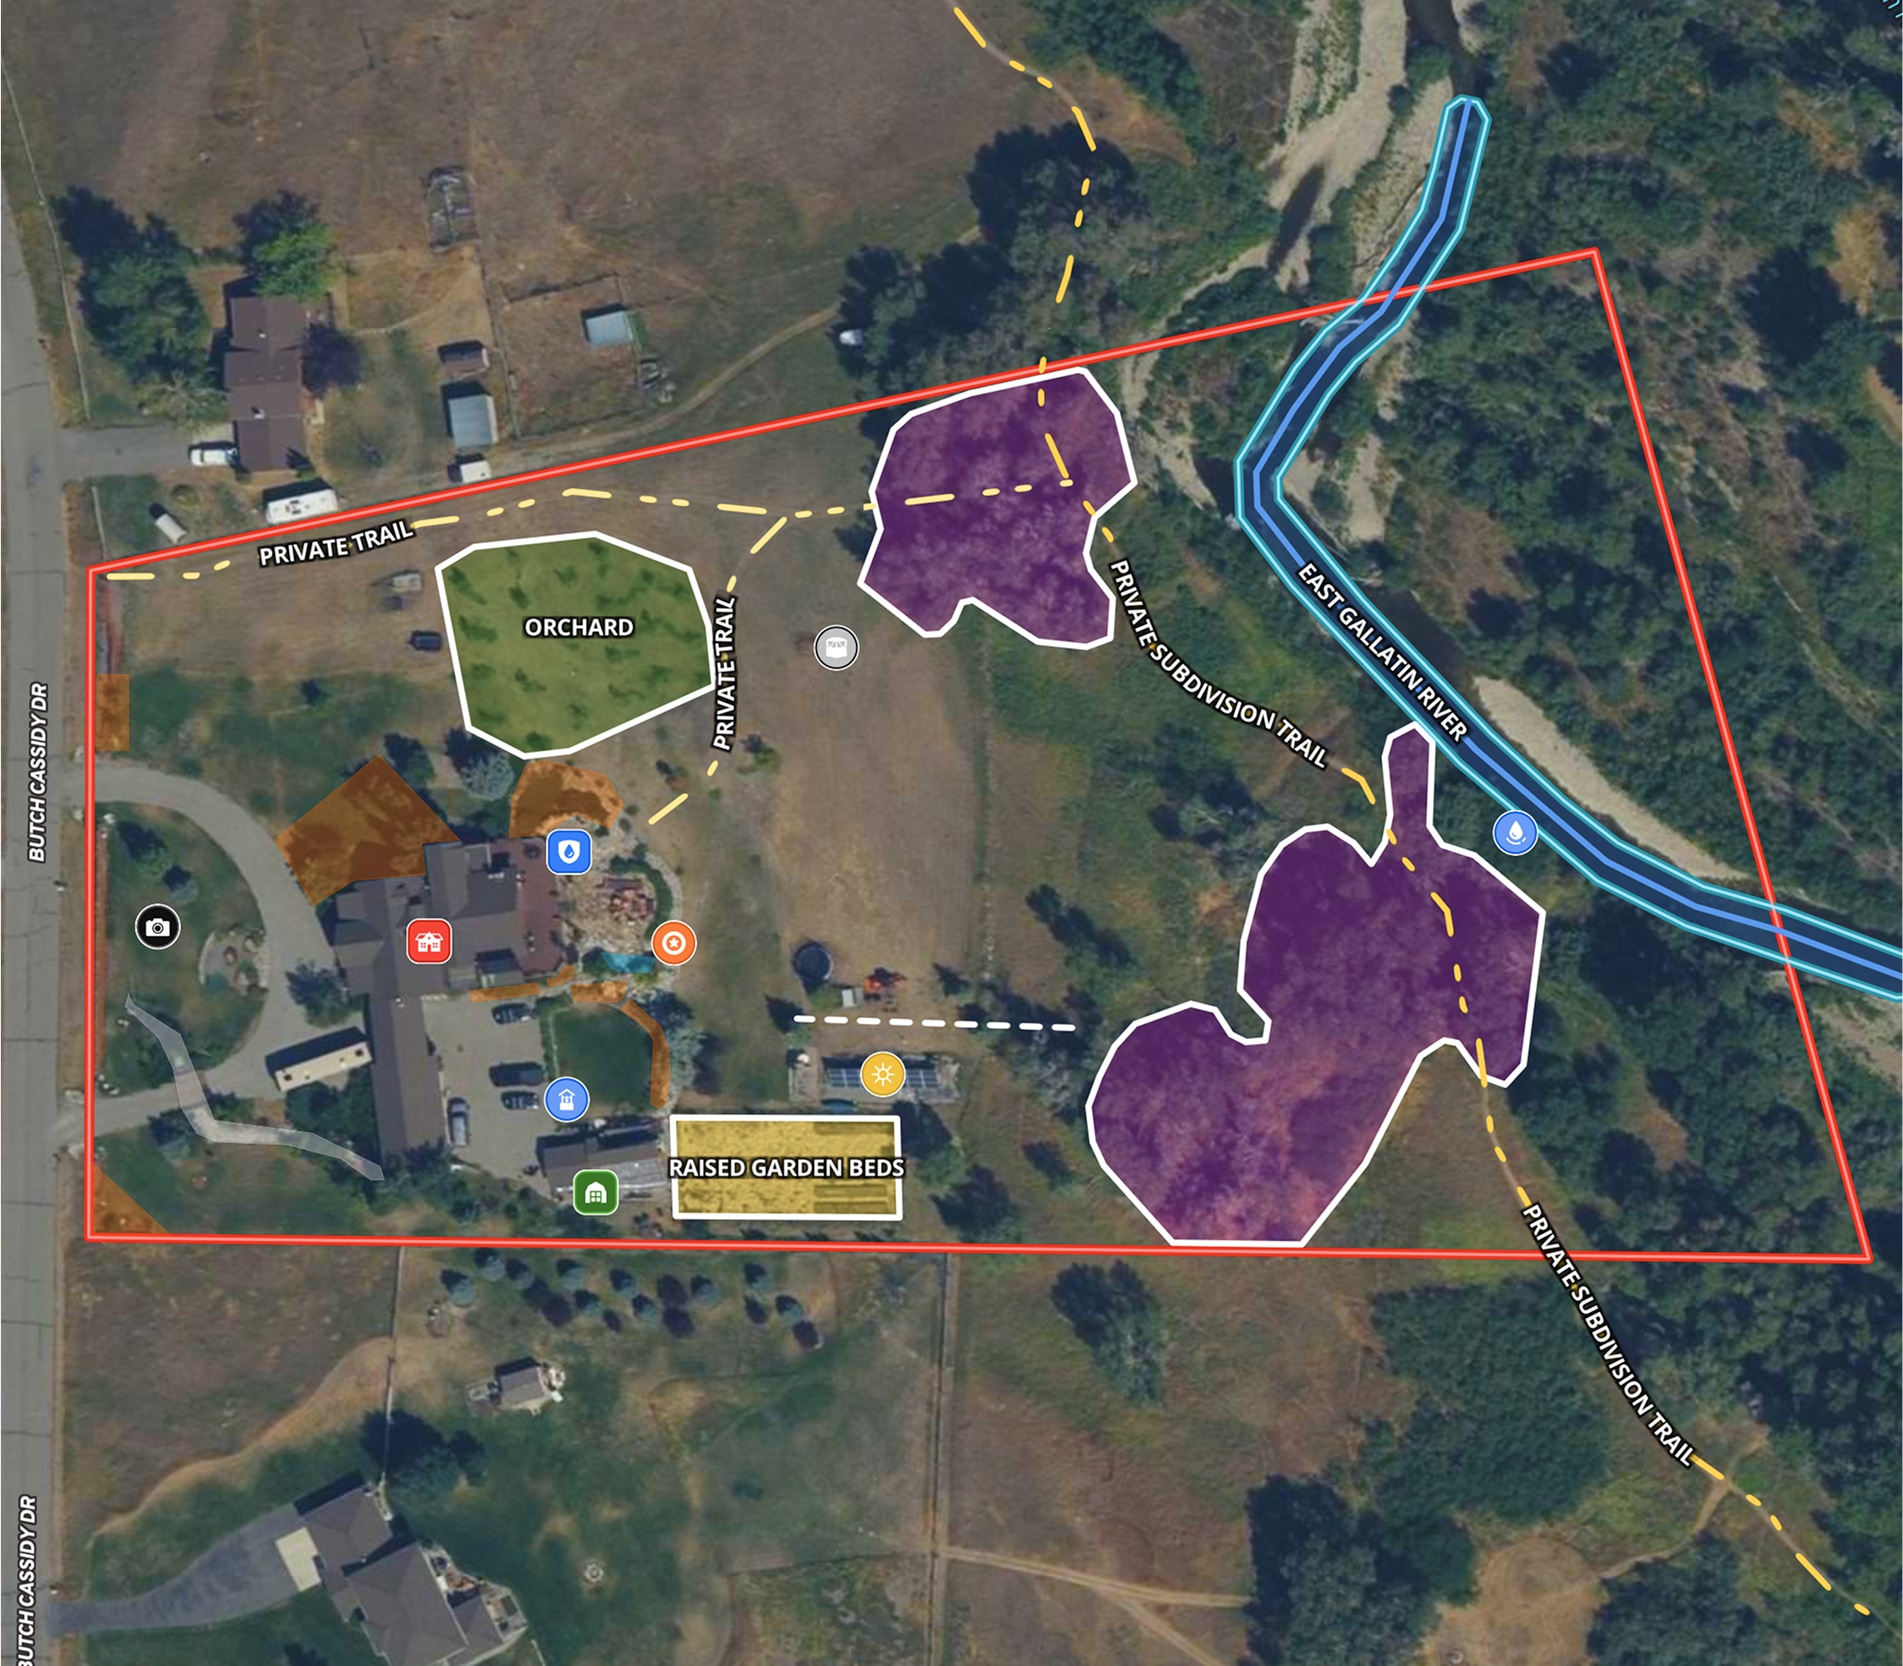
- Add labels to maps and mapped items
- Manage and visualize data with Attributes
- Winning listings with property mapping techniques
Keep Exploring

5.6 Acre Rural Listing in Bozeman, MT

Commercial Real Estate Off-Market Prospecting

Subdivided Lots for Sale
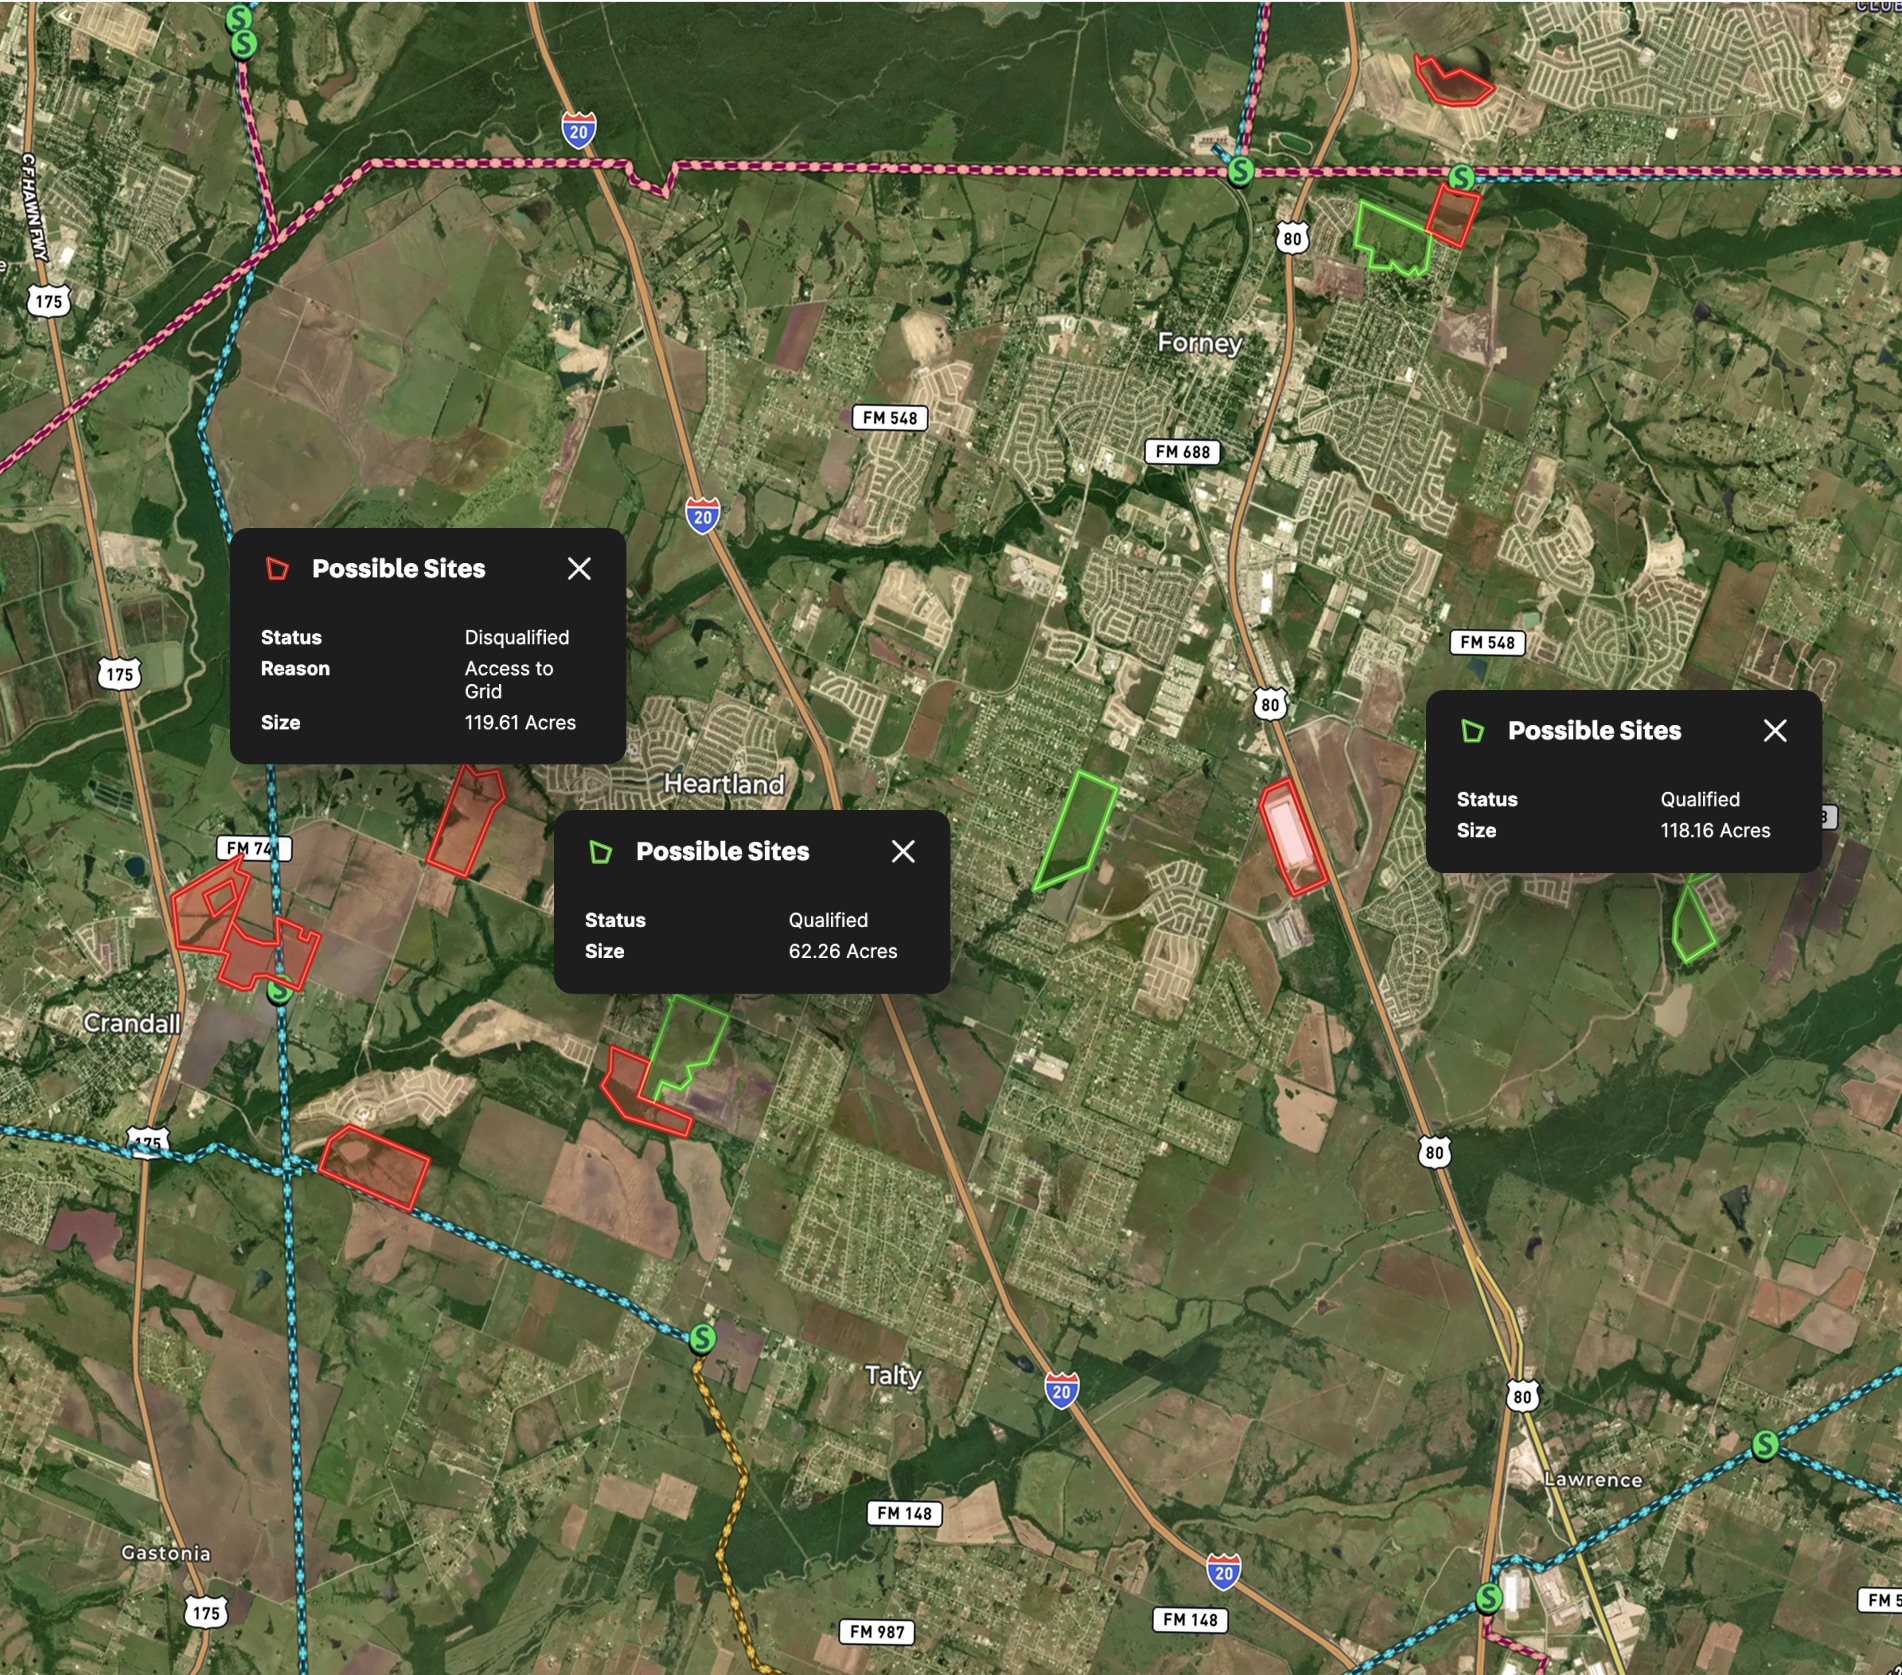
Data Center Development Site Analysis
Take Your Mapping to the Next Level
Mapping is just the beginning. Land id is the #1 tool for researching, discovering, and showcasing land, and we're here to help you make the most of it, every step of the way.